Multiplication Chart 1–20
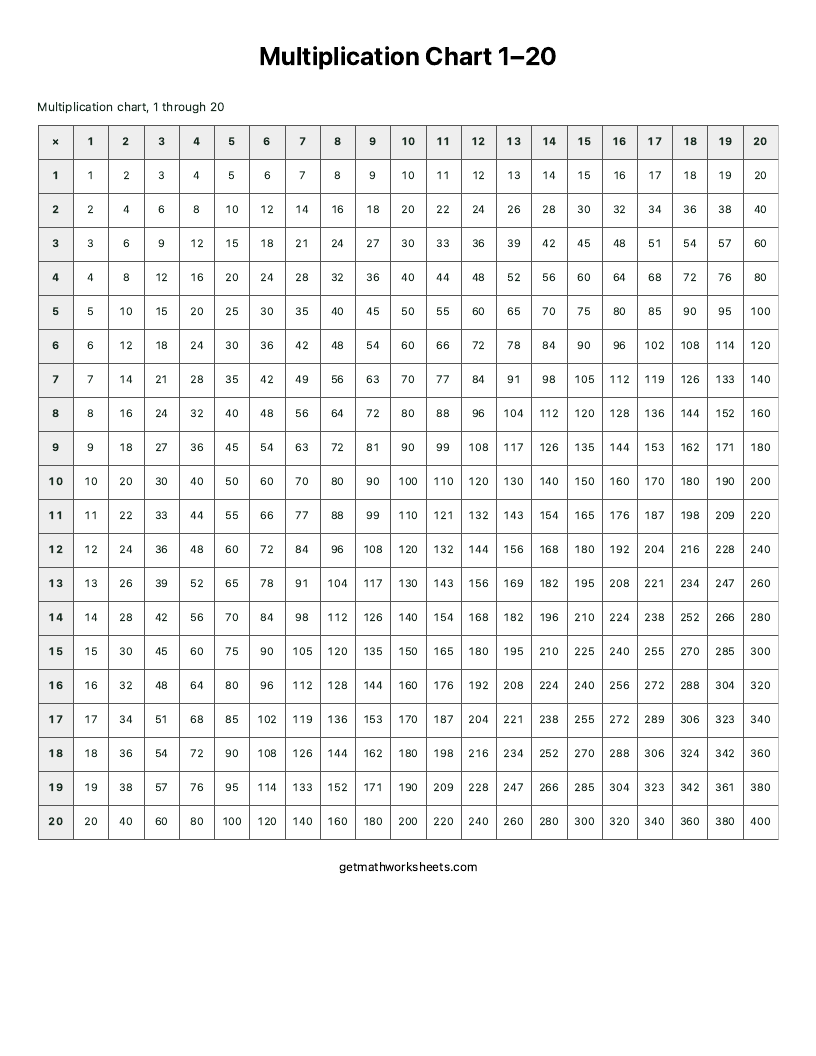
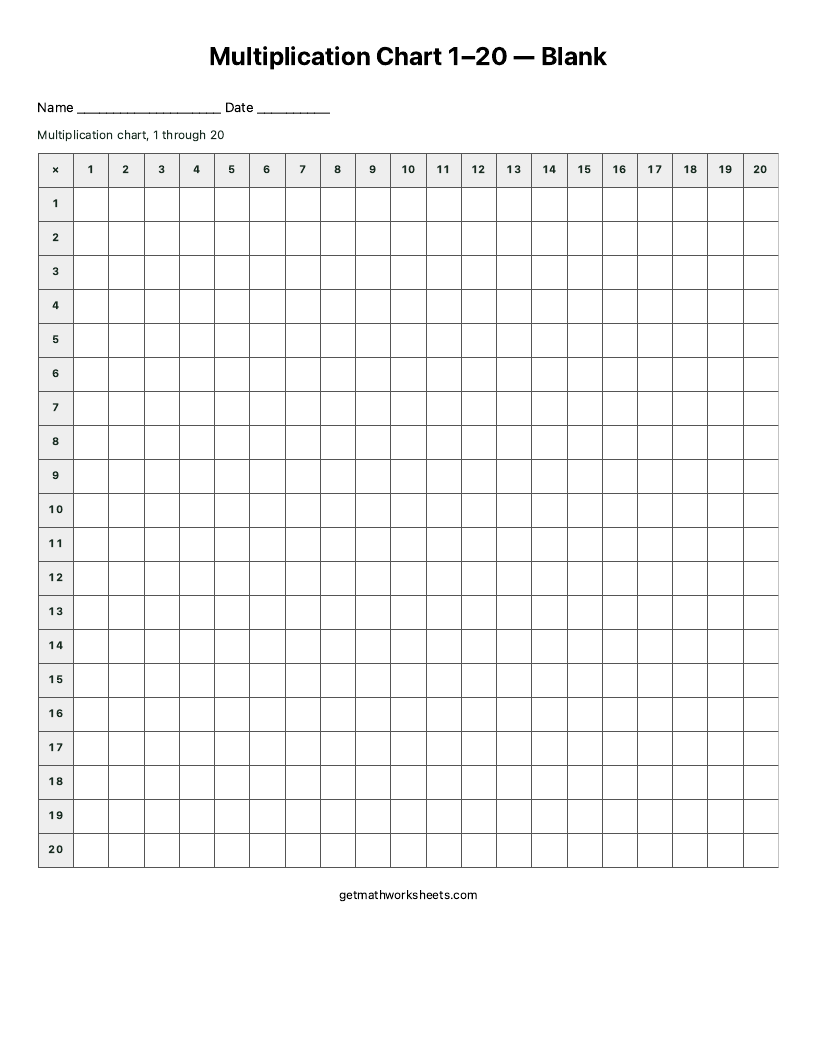
A free printable 20×20 multiplication chart with every product from 1 × 1 to 20 × 20. Print it complete for reference, blank for practice, or partly filled in, on US Letter or A4.
The chart has 400 product cells and fits on one page. For the facts most learners practice first, use the 1–12 multiplication chart. To fill the products in by hand, the blank multiplication chart has a 20×20 PDF with the completed chart on page 2.
Multiplication Chart 1–20
Name ____________________ Date __________
For the 1–20 chart, scroll sideways to see every column. You can also focus the chart and use the arrow keys.
| × | 1 | 2 | 3 | 4 | 5 | 6 | 7 | 8 | 9 | 10 | 11 | 12 | 13 | 14 | 15 | 16 | 17 | 18 | 19 | 20 |
|---|---|---|---|---|---|---|---|---|---|---|---|---|---|---|---|---|---|---|---|---|
| 11 | 1 | 2 | 3 | 4 | 5 | 6 | 7 | 8 | 9 | 10 | 11 | 12 | 13 | 14 | 15 | 16 | 17 | 18 | 19 | 20 |
| 22 | 2 | 4 | 6 | 8 | 10 | 12 | 14 | 16 | 18 | 20 | 22 | 24 | 26 | 28 | 30 | 32 | 34 | 36 | 38 | 40 |
| 33 | 3 | 6 | 9 | 12 | 15 | 18 | 21 | 24 | 27 | 30 | 33 | 36 | 39 | 42 | 45 | 48 | 51 | 54 | 57 | 60 |
| 44 | 4 | 8 | 12 | 16 | 20 | 24 | 28 | 32 | 36 | 40 | 44 | 48 | 52 | 56 | 60 | 64 | 68 | 72 | 76 | 80 |
| 55 | 5 | 10 | 15 | 20 | 25 | 30 | 35 | 40 | 45 | 50 | 55 | 60 | 65 | 70 | 75 | 80 | 85 | 90 | 95 | 100 |
| 66 | 6 | 12 | 18 | 24 | 30 | 36 | 42 | 48 | 54 | 60 | 66 | 72 | 78 | 84 | 90 | 96 | 102 | 108 | 114 | 120 |
| 77 | 7 | 14 | 21 | 28 | 35 | 42 | 49 | 56 | 63 | 70 | 77 | 84 | 91 | 98 | 105 | 112 | 119 | 126 | 133 | 140 |
| 88 | 8 | 16 | 24 | 32 | 40 | 48 | 56 | 64 | 72 | 80 | 88 | 96 | 104 | 112 | 120 | 128 | 136 | 144 | 152 | 160 |
| 99 | 9 | 18 | 27 | 36 | 45 | 54 | 63 | 72 | 81 | 90 | 99 | 108 | 117 | 126 | 135 | 144 | 153 | 162 | 171 | 180 |
| 1010 | 10 | 20 | 30 | 40 | 50 | 60 | 70 | 80 | 90 | 100 | 110 | 120 | 130 | 140 | 150 | 160 | 170 | 180 | 190 | 200 |
| 1111 | 11 | 22 | 33 | 44 | 55 | 66 | 77 | 88 | 99 | 110 | 121 | 132 | 143 | 154 | 165 | 176 | 187 | 198 | 209 | 220 |
| 1212 | 12 | 24 | 36 | 48 | 60 | 72 | 84 | 96 | 108 | 120 | 132 | 144 | 156 | 168 | 180 | 192 | 204 | 216 | 228 | 240 |
| 13 | 13 | 26 | 39 | 52 | 65 | 78 | 91 | 104 | 117 | 130 | 143 | 156 | 169 | 182 | 195 | 208 | 221 | 234 | 247 | 260 |
| 14 | 14 | 28 | 42 | 56 | 70 | 84 | 98 | 112 | 126 | 140 | 154 | 168 | 182 | 196 | 210 | 224 | 238 | 252 | 266 | 280 |
| 15 | 15 | 30 | 45 | 60 | 75 | 90 | 105 | 120 | 135 | 150 | 165 | 180 | 195 | 210 | 225 | 240 | 255 | 270 | 285 | 300 |
| 16 | 16 | 32 | 48 | 64 | 80 | 96 | 112 | 128 | 144 | 160 | 176 | 192 | 208 | 224 | 240 | 256 | 272 | 288 | 304 | 320 |
| 17 | 17 | 34 | 51 | 68 | 85 | 102 | 119 | 136 | 153 | 170 | 187 | 204 | 221 | 238 | 255 | 272 | 289 | 306 | 323 | 340 |
| 18 | 18 | 36 | 54 | 72 | 90 | 108 | 126 | 144 | 162 | 180 | 198 | 216 | 234 | 252 | 270 | 288 | 306 | 324 | 342 | 360 |
| 19 | 19 | 38 | 57 | 76 | 95 | 114 | 133 | 152 | 171 | 190 | 209 | 228 | 247 | 266 | 285 | 304 | 323 | 342 | 361 | 380 |
| 20 | 20 | 40 | 60 | 80 | 100 | 120 | 140 | 160 | 180 | 200 | 220 | 240 | 260 | 280 | 300 | 320 | 340 | 360 | 380 | 400 |
Multiplication Chart 1–20 — Answer Key
Multiplication chart 1–20: complete and blank samples
These images are captured from the actual US Letter print output. Choose Complete or Blank in the controls above, then Print / Save PDF; check Include answer chart when printing to add a completed answer page to a blank or practice chart.
What the 1–20 chart adds
A 12×12 chart has 144 products. The 20×20 chart has 400, so 256 of its cells involve 13 through 20 as a factor. Because 7 × 16 equals 16 × 7, the chart mirrors itself across the diagonal: it holds 210 different factor pairs, and the largest product is 400.
Common Core 3.OA.C.7 asks for recall of products of two one-digit numbers by the end of Grade 3, and many fact-fluency goals stop at 10 × 10 or 12 × 12. Treat the larger rows as a reference for bigger products, such as checking 16 × 13 or listing multiples of 15, rather than as facts to memorize.
Patterns from 13 to 20
- 14, 16 and 18: each is double a smaller table. 16 × 7 = 112, twice 8 × 7 = 56; 18 × 6 = 108, twice 9 × 6 = 54.
- 15: products alternate between ending in 5 and ending in 0: 15, 30, 45, 60.
- 19: one group less than 20. 19 × 6 = 20 × 6 − 6 = 120 − 6 = 114.
- 20: double the 10s, so every product ends in 0. 20 × 7 = 140.
The diagonal continues the square numbers past 144: 13 × 13 = 169, 14 × 14 = 196, 15 × 15 = 225, 16 × 16 = 256, 17 × 17 = 289, 18 × 18 = 324, 19 × 19 = 361, 20 × 20 = 400. Turn on Highlight square numbers to shade them.
Work out a product from 13 to 20
Split the teen factor into ten and the rest, then add the two parts. 14 × 6 is 10 × 6 + 4 × 6 = 60 + 24 = 84. 17 × 8 is 10 × 8 + 7 × 8 = 80 + 56 = 136. Find the answer on the chart afterwards to check it. The same split works for division: 136 ÷ 8 is 17 because 80 ÷ 8 = 10 and 56 ÷ 8 = 7.
Printing a 20×20 chart
The cells are smaller than on the 1–12 chart, so print at 100% scale with browser headers and footers turned off. A complete chart prints on one page. A blank or practice chart with the answer option checked prints a second, completed page. On a phone, the chart scrolls sideways; focus it and use the arrow keys to move across.
Practice one table at a time
Row headers 1 to 12 link to a worksheet for that table. For a single table, start with its worksheet, or try the times tables speed test once the facts are familiar. Division facts up to 12 are grouped by divisor on the division chart.