Blank Multiplication Chart
A free printable blank multiplication chart: the factor headers 1 to 12 stay in place and all 144 product cells are empty for the learner to fill in. Print it from your browser or download a ready-made PDF for 1–10, 1–12 or 1–20, each with the completed chart on page 2 for checking.
Choose 1–10 or 1–20 in Range to change the grid, or Practice to leave some products in as clues. For the finished chart to read from, use the complete multiplication chart or the multiplication chart 1–20.
Multiplication Chart 1–12 — Blank
Name ____________________ Date __________
For the 1–20 chart, scroll sideways to see every column. You can also focus the chart and use the arrow keys.
Multiplication Chart 1–12 — Answer Key
Download a blank multiplication chart PDF
Each PDF has two pages: the blank chart with a Name and Date line, then the same chart completed as an answer key. Print page 1 for the learner and keep page 2 for checking. The files are the same output as the Print / Save PDF button above with Include answer chart checked.
- 10×10 blank multiplication chart (100 cells): US Letter PDF · A4 PDF
- 12×12 blank multiplication chart (144 cells): US Letter PDF · A4 PDF
- 20×20 blank multiplication chart (400 cells): US Letter PDF · A4 PDF
Blank multiplication chart samples: 10×10, 12×12 and 20×20
These images are captured from the actual US Letter print output. Each PDF above adds the completed chart as a second page; Print / Save PDF does the same when Include answer chart when printing is checked.
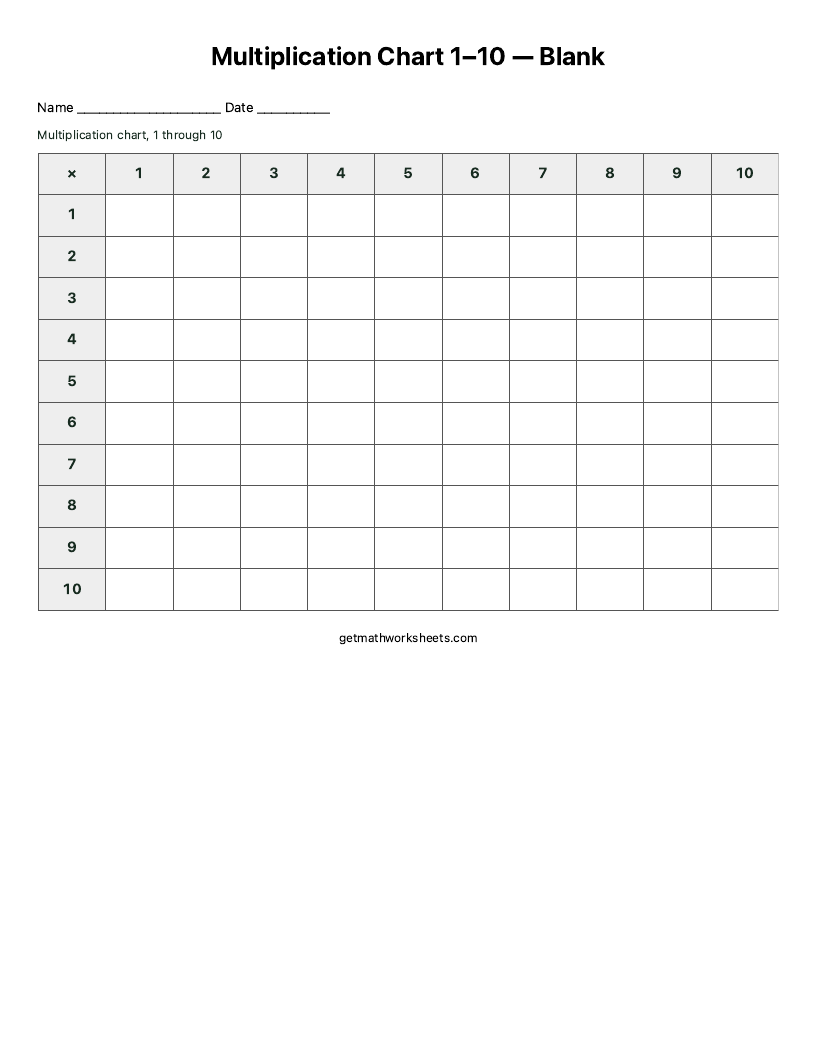
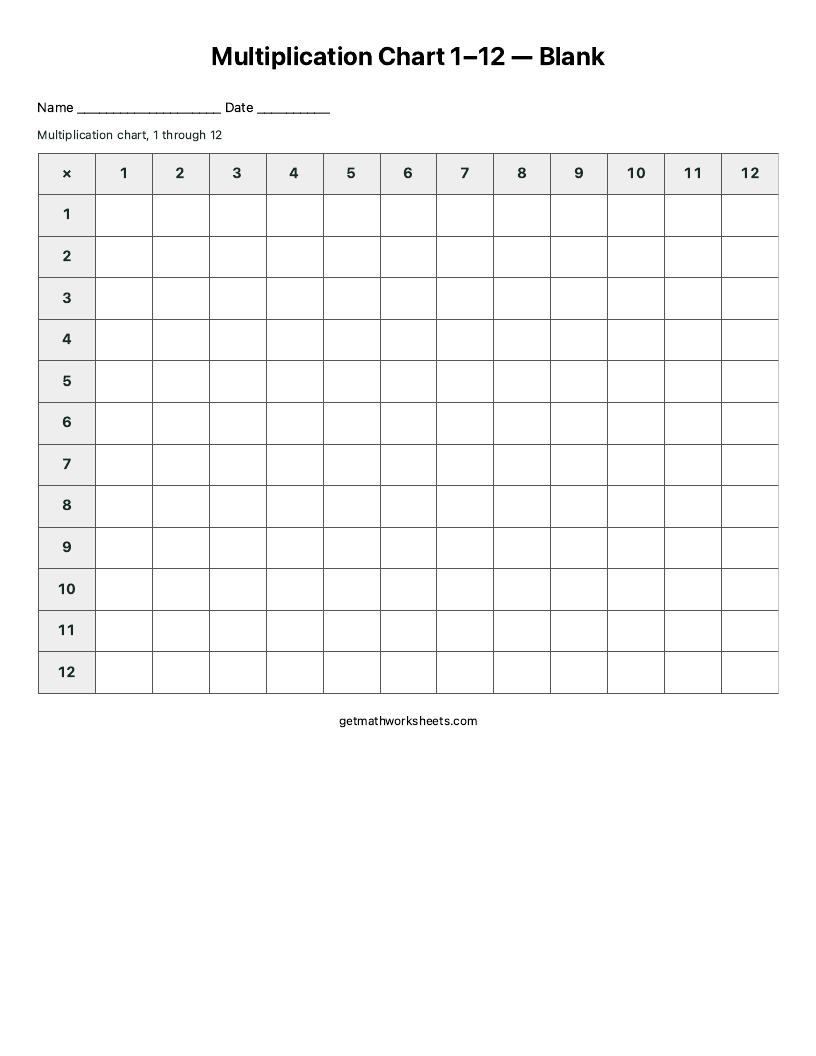
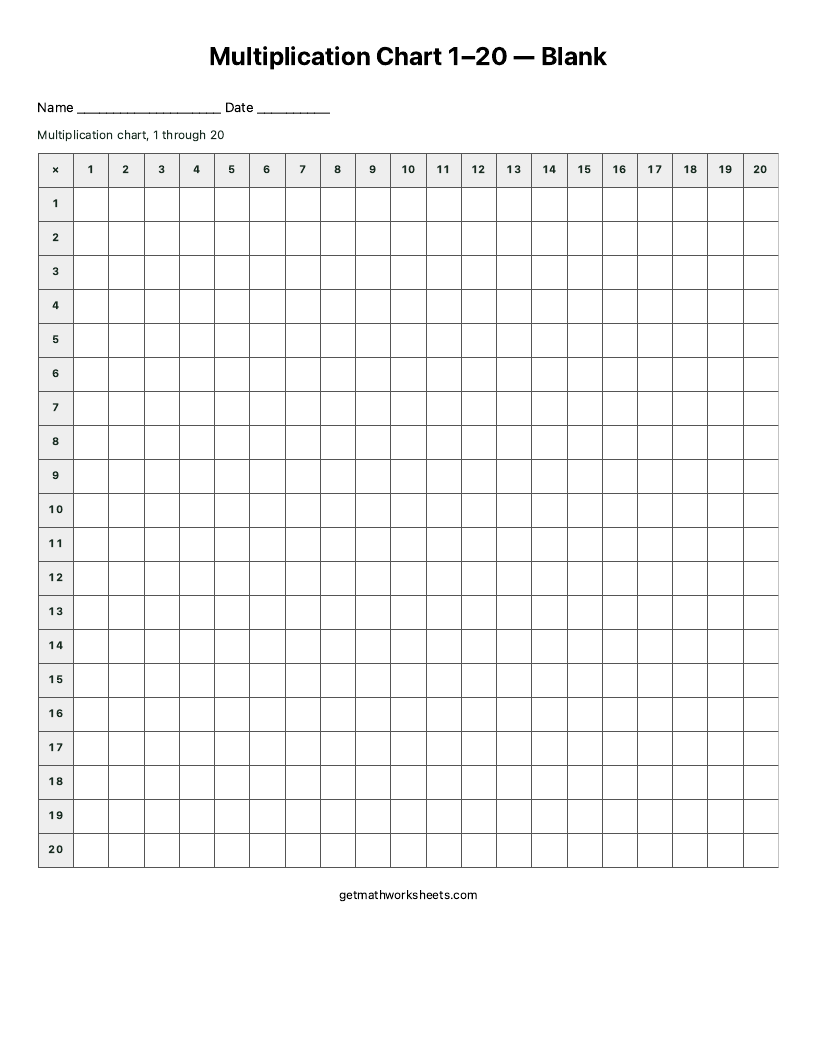
How to fill in a blank multiplication chart
Start with the rows the learner already knows, usually the 1s, 2s, 5s and 10s, so the grid fills quickly and the remaining gaps stand out. Then work down the diagonal: the square numbers 1, 4, 9, 16 and so on up to 12 × 12 = 144. Every other product appears twice, because 7 × 8 and 8 × 7 are both 56; once a learner has filled one side of the diagonal, the other side is a copy. Writing a product means recalling it, which is harder than reading it from a completed chart, so a filled-in blank chart is a check of what is known rather than a reference.
Blank chart or practice chart
The blank chart leaves all 144 cells empty. The Practice type keeps about 60% of the products in place and hides the rest, so the learner has clues in every row; New practice chart changes which cells are hidden while the facts stay the same. Use Practice first when a full blank grid looks like too much, then move to the blank chart once most rows come easily.
Checking the answers
Page 2 of each PDF is the completed chart in the same layout, so the two pages can be laid side by side or held up to the light. In the browser, check Include answer chart when printing to add that page. Looking up a single fact, such as 6 × 9 = 54, works the same way on the 1–12 chart: find the row, move across to the column, and read the cell where they meet.
Which size to print
- 10×10 (100 cells): the facts up to 10 × 10 that Common Core 3.OA.C.7 expects by the end of Grade 3. Cells are large, so it suits younger learners.
- 12×12 (144 cells): the usual times tables range, adding the 11s and 12s. This is the chart shown above.
- 20×20 (400 cells): for extended practice up to 400. Cells are small, so print at 100% scale with browser headers and footers turned off.
Practice one table at a time
Row headers 1 to 12 link to a worksheet for that table. If one row keeps staying empty, start with its worksheet, or make a mixed multiplication worksheet from the tables that need work. For an online check with feedback, try times tables practice.